Heat maps for websites
Do you optimize your website based on gut feeling, but the conversion rate remains stubbornly low? The problem: You don't know what your visitors are really doing, where they're clicking, and when they're jumping off. In this article, you'll learn how website heat maps reveal user behavior and how to measurably increase your conversion rate with color-coded user data.

What is a heatmap?
A heatmap is a colour-coded representation of data. It is a map on which different areas are coloured differently. It shows the varying intensity of activities: red areas mean “a lot is happening here”, blue areas “little is happening here”.
You probably know the principle from the weather forecast, where temperatures, wind or rain are shown in colour. Or from building thermography, where thermal imaging cameras reveal weak points in insulation.

What are website heatmaps?
Website heatmaps are visual tools that record and colour-code the behaviour of visitors on your website. They show you how users actually behave there.
These tools record where users click, how far they scroll, and where they move their mouse. This data is then placed on your website as a coloured overlay. Based on the colours, you can then see:
- Which areas attract attention
- Where visitors lose interest
- Which buttons or other elements are overlooked
Website heatmaps are mainly used for conversion rate optimisation. It is important to learn how users behave and how you can better guide them to the desired action.
The main types of website heatmaps
The most important types of website heatmaps are click heatmaps to record user clicks or taps, scroll heatmaps that show how far visitors actually scroll down, mouse movement heatmaps to track mouse movement, and attention heatmaps that combine this data. There is also the distinction between desktop and mobile heatmaps.
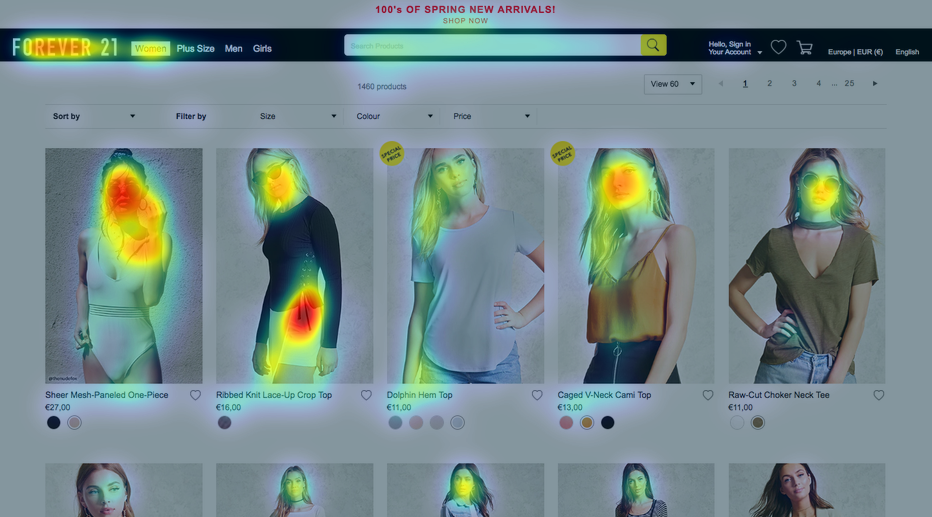
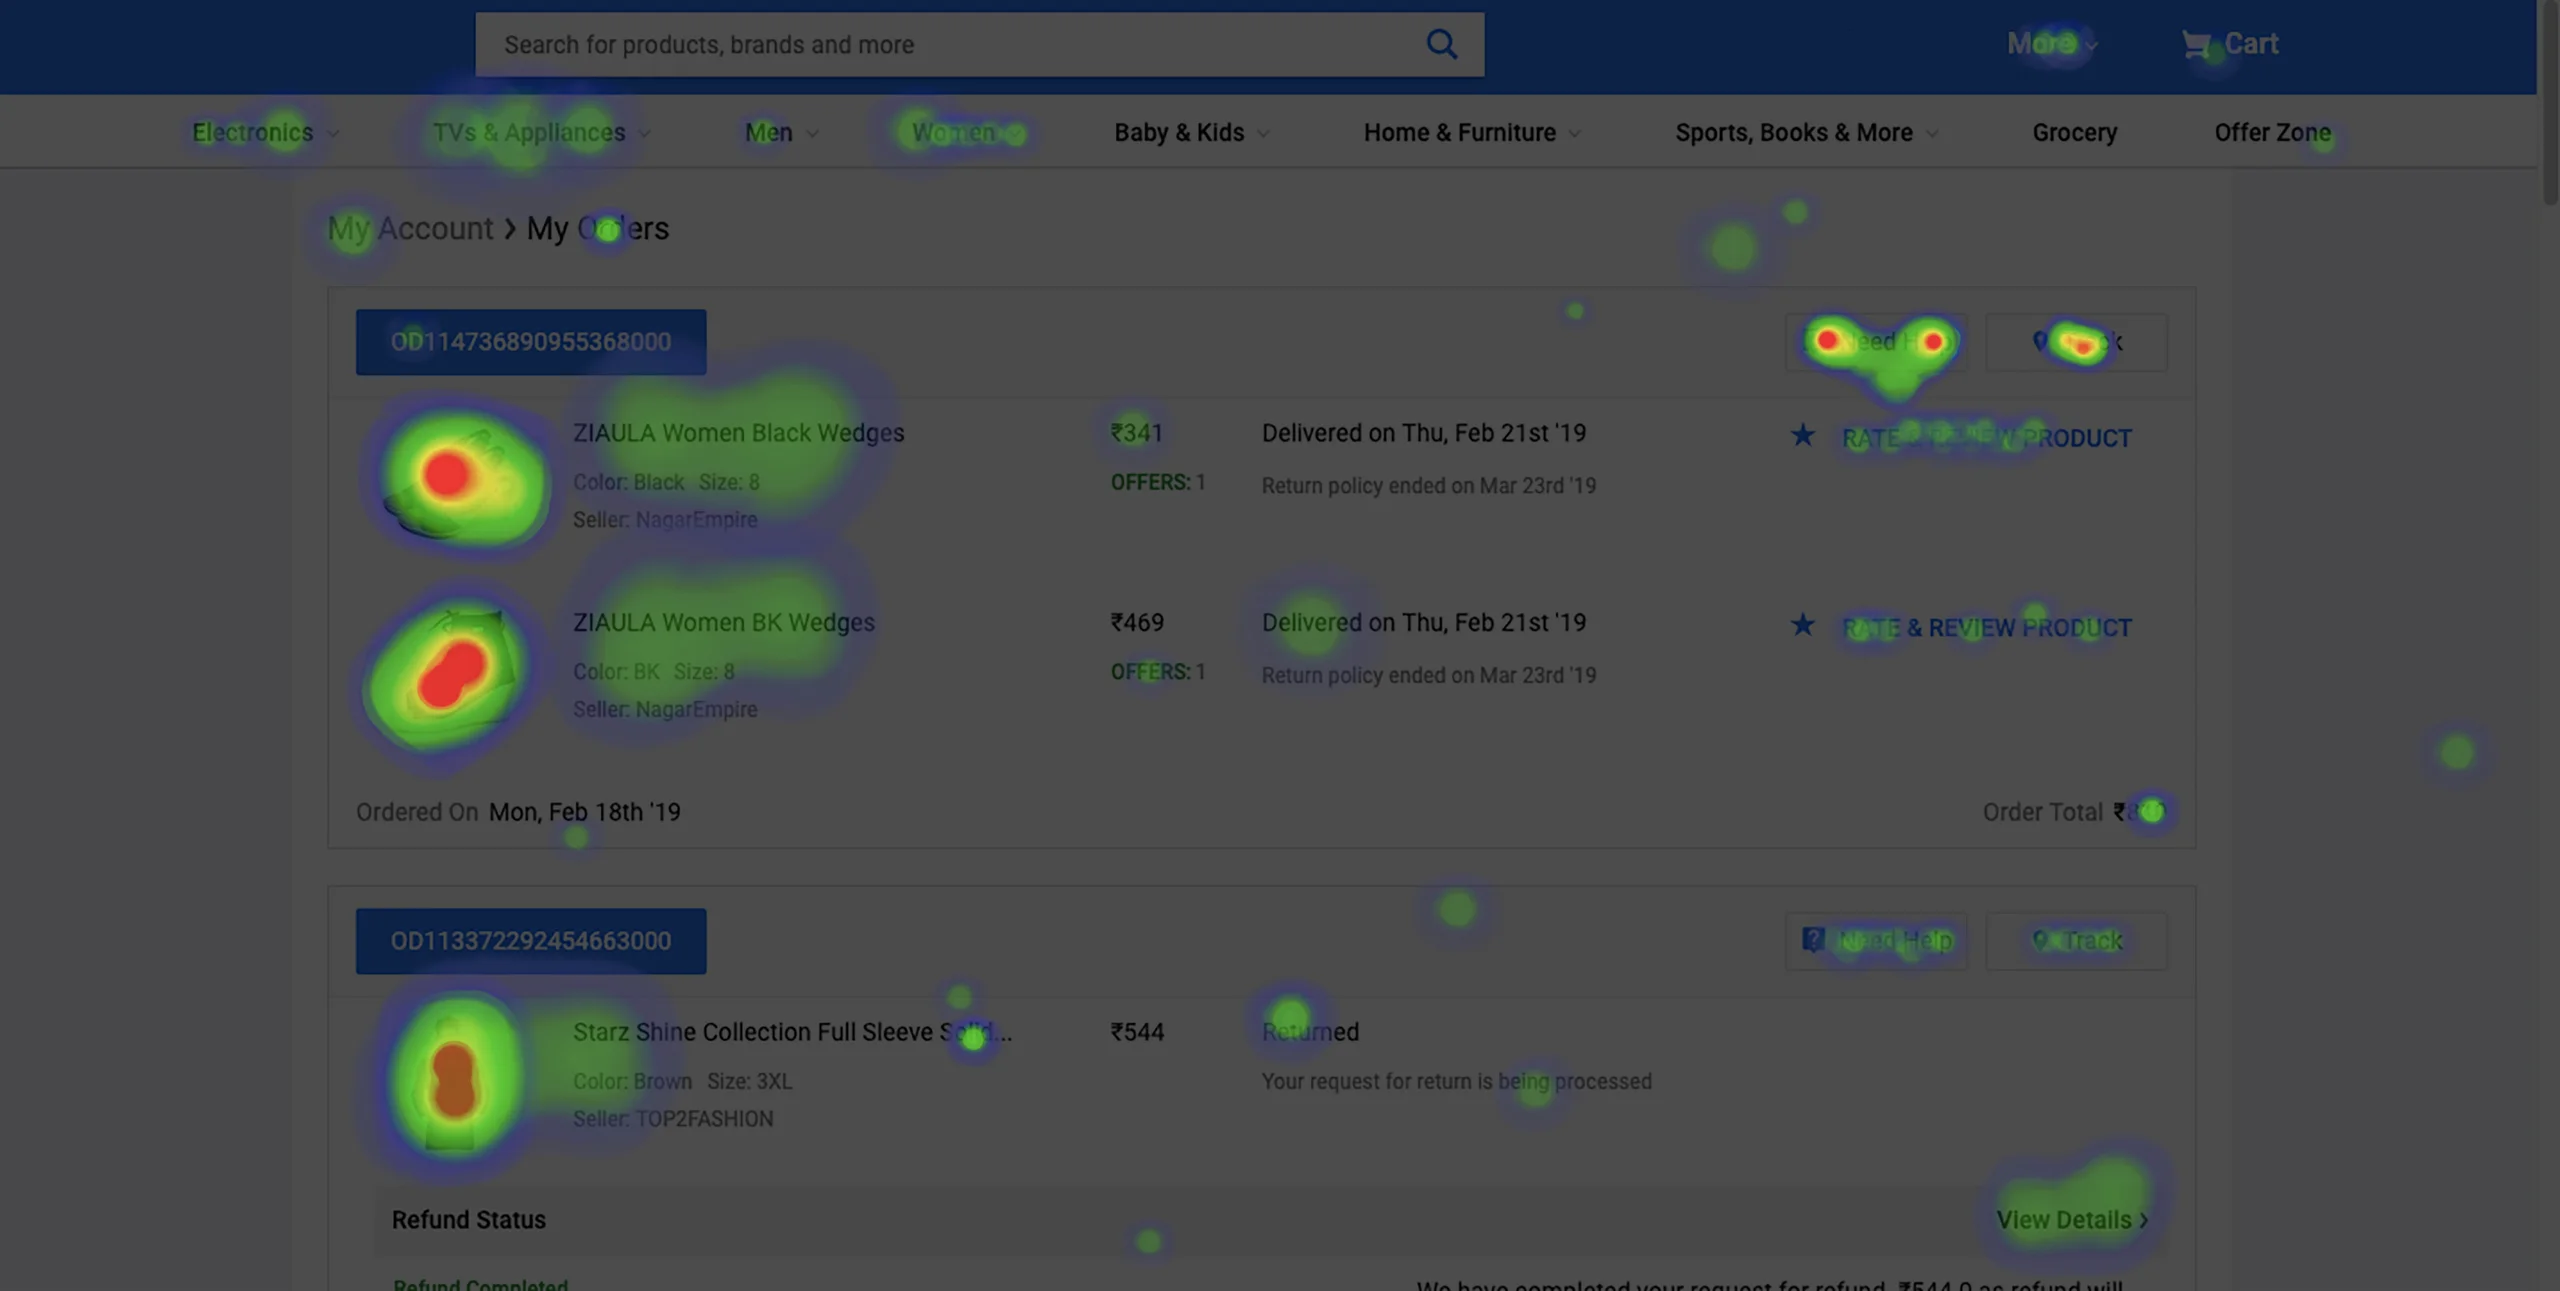
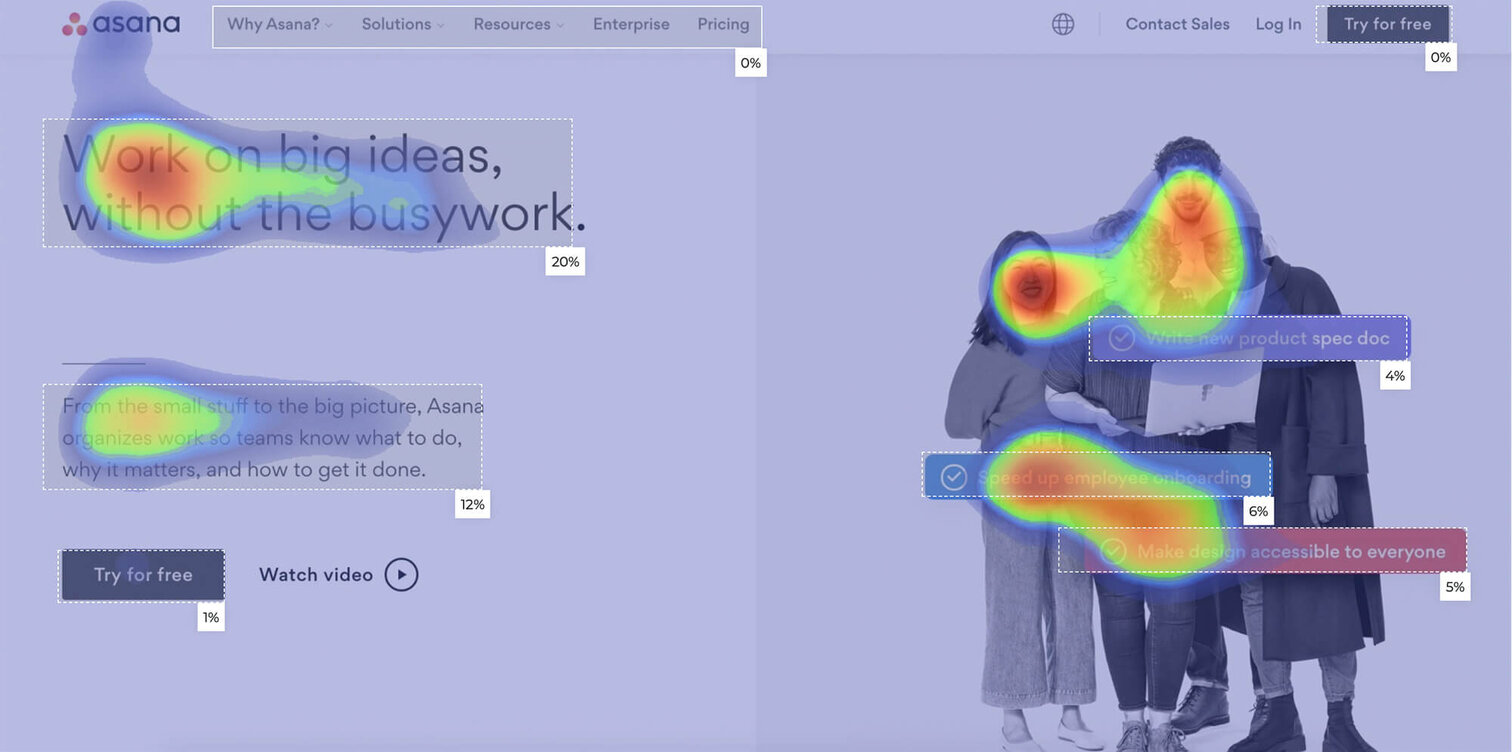
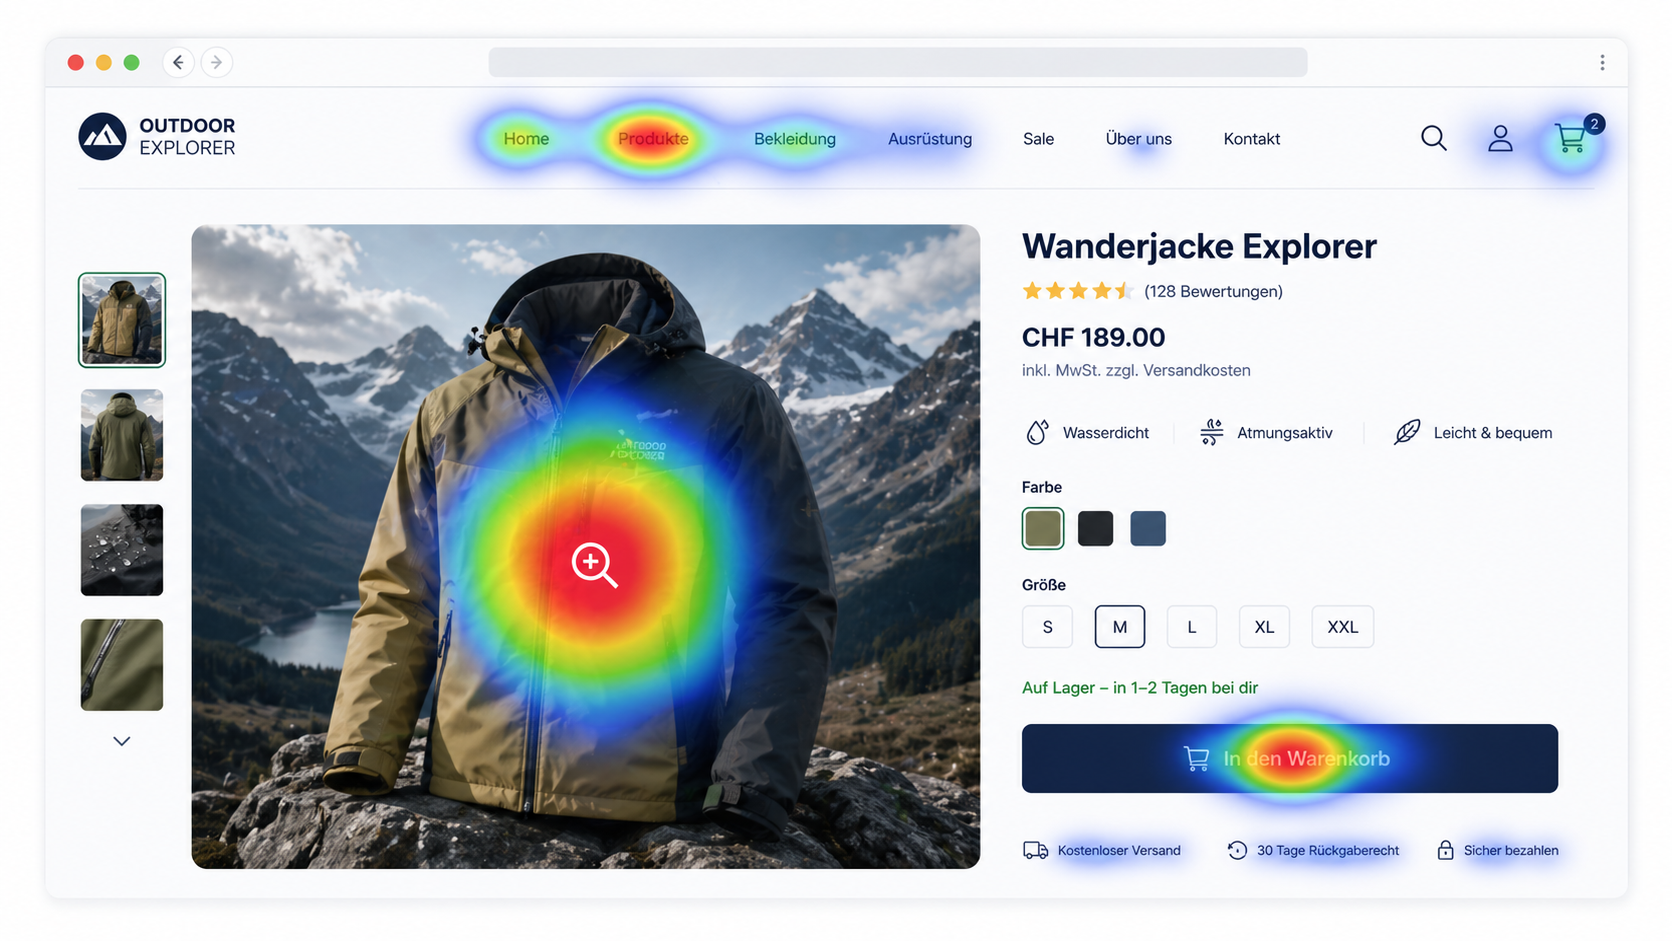
Click heatmaps
Click heatmaps show you where visitors are clicking (PC, laptop) or tapping (tablet, smartphone). Red areas mark the frequently clicked spots, blue areas are largely ignored by users. You can see which buttons are working and where users click — even if a click at that point does not currently trigger any action.
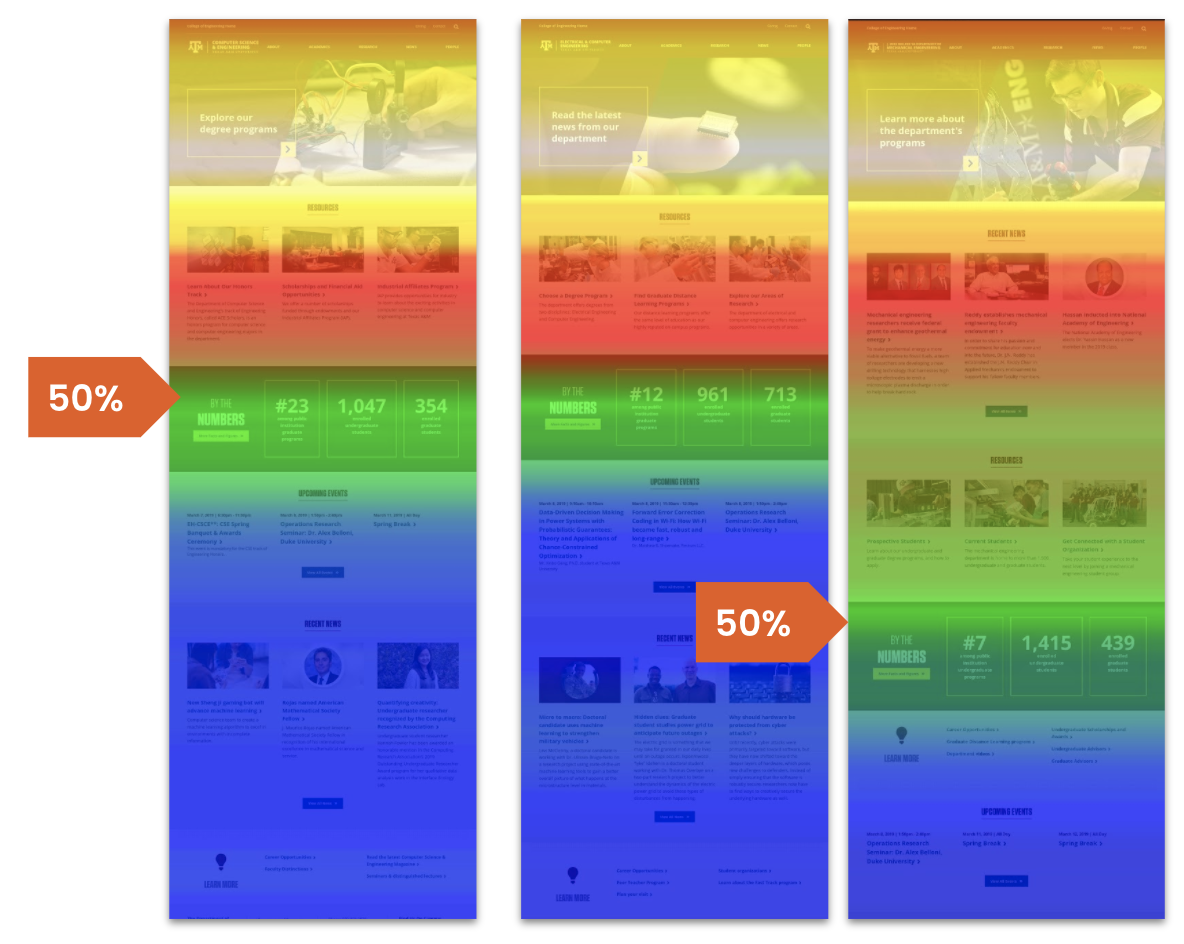
Scroll heatmaps
Scroll heatmaps tell you how far down your page visitors are scrolling. The colours get colder as fewer users reach that point. You can see where most visitors leave your site and whether important content is therefore positioned too low.
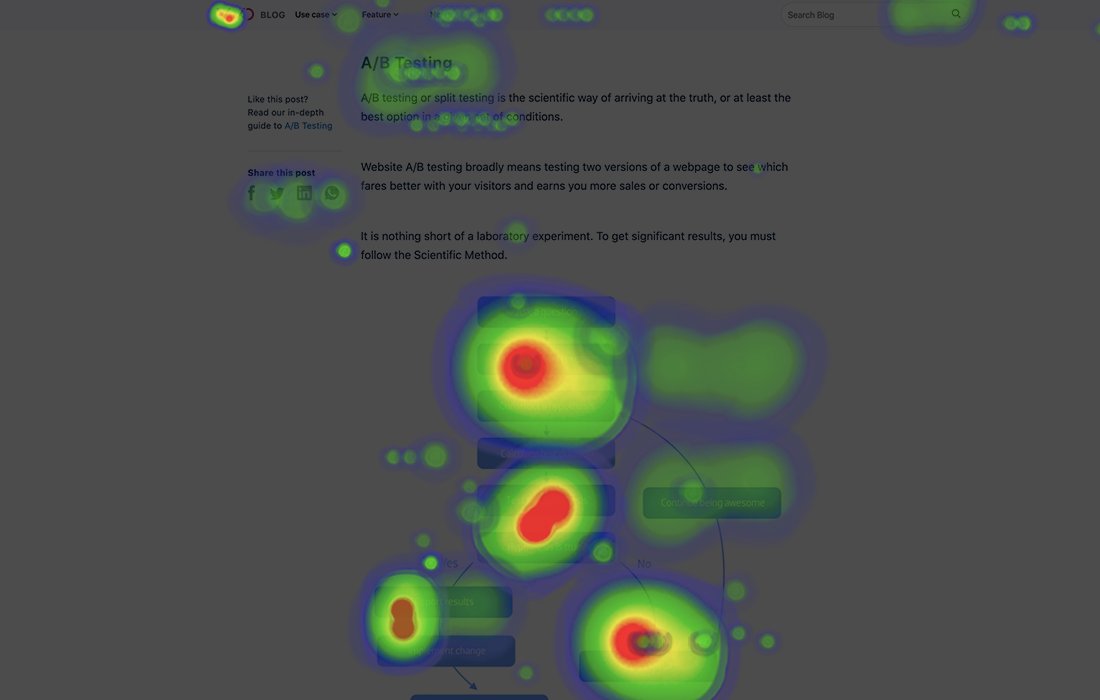
Mouse movement heatmaps
These heatmaps track the mouse movements of website visitors. The idea behind this is that people often move their mouse wherever they look, making mouse movement heatmaps a cost-effective alternative to eye tracking. However, accuracy is disputed, as not every mouse movement corresponds to the gaze.
Attention heatmaps
Attention heatmaps combine various data sources: clicks, scrolling behaviour, and time spent. They show you which areas receive the most attention overall and serve as a complete picture of user behaviour on the website.
Website heatmaps for desktop and mobile
Mobile and desktop users behave completely differently, and heatmaps must reflect this. On smartphones, users tap instead of clicking, so there is no mouse movement — mouse movement heatmaps are therefore not applicable here. Scrolling behaviour on tablets and smartphones differs from laptops or PCs, and users have less patience when browsing on mobile.
The key differences: mobile users scroll faster and further, but they also drop off more frequently. Buttons must be larger because fingers are less precise than mouse pointers. What works on desktop can completely fail on mobile.
That’s why you should always look at heatmaps separately by device type. Many tools offer this filtering as standard. This way you can see: does your design really work on all devices? Or are you only optimising for desktop users while mobile visitors drop off in frustration?
What are website heatmaps used for?
Heatmaps are a widely used tool for conversion rate optimisation (CRO). They provide you with the data you need to turn visitors into customers.
Conversion rate optimisation means: you systematically improve the percentage of visitors who perform a desired action — a purchase, registration, or download. Instead of buying more ads to drive traffic to your website, you get more out of your existing traffic.
Website heatmaps show you where your conversion funnels still have gaps, where you’re losing potential customers, and which elements are distracting users from your goals.
Identify conversion killers with website heatmaps
Heatmaps reveal where users get stuck. Is no one scrolling down to your most important call-to-action? Do visitors click on elements that aren’t clickable? You can immediately see such problems in the heatmap display.
This also lets you better understand user expectations. If users often click on an image but nothing happens, you can tell that they expect an action there — typically to enlarge the image. You can then add that functionality.
Optimise the placement of buttons and elements
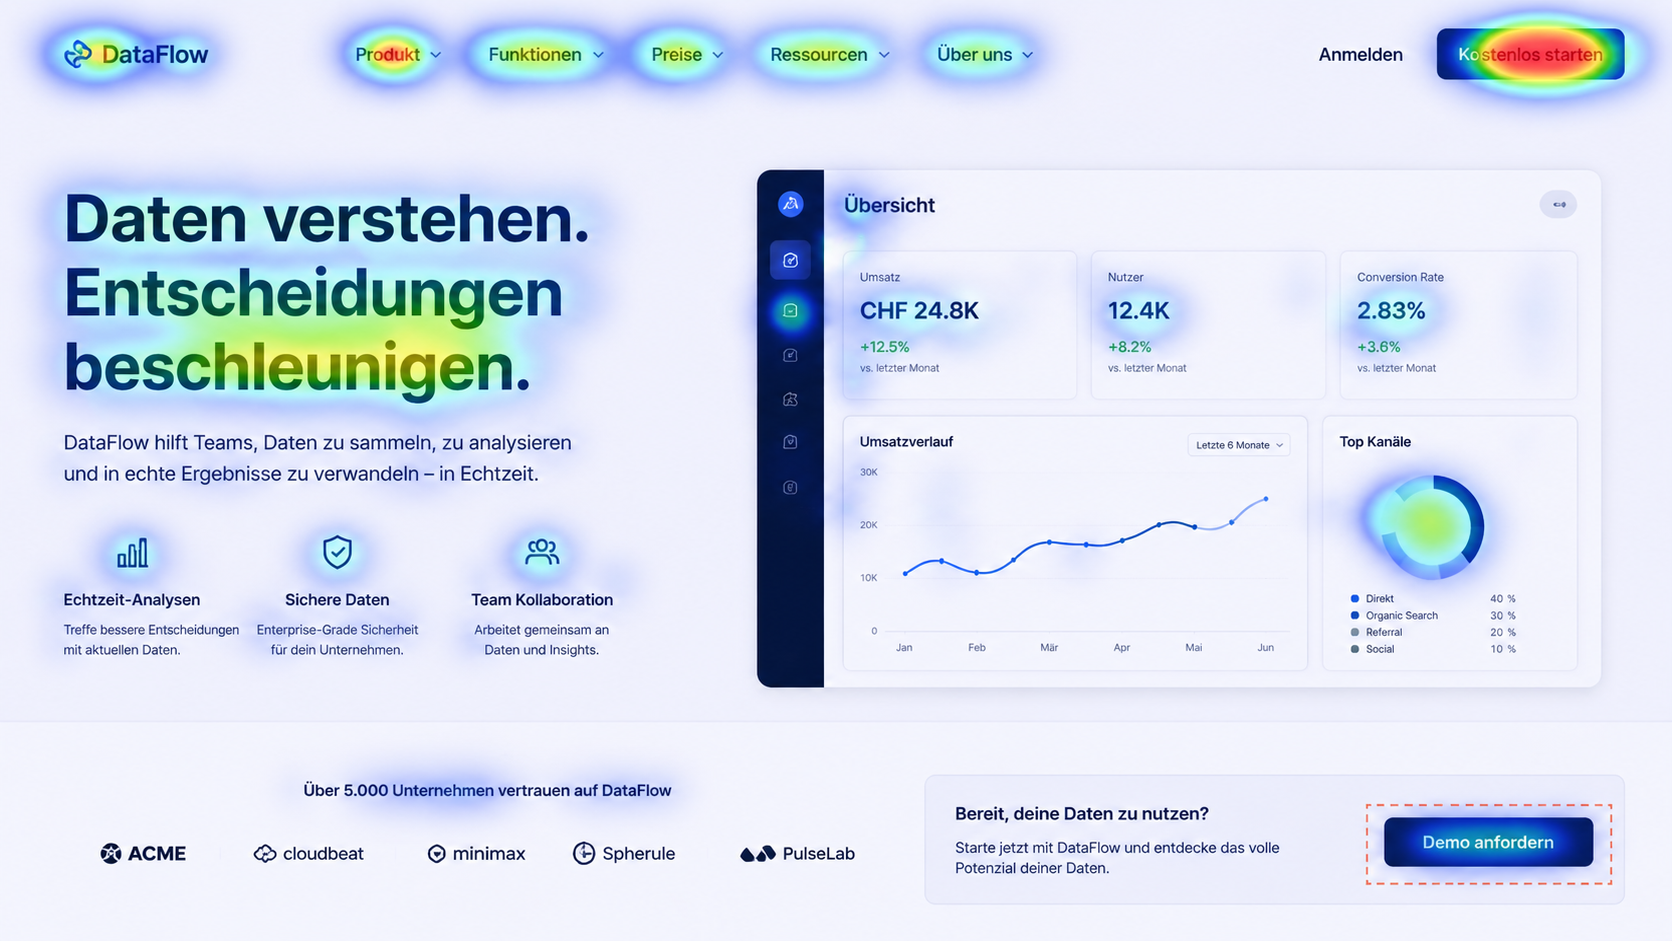
Did you think the new button would stand out? The heatmap shows you whether that’s true. Important buttons are often overlooked while other elements receive unexpected attention. With insights like these, you can specifically adjust your layout.
Measure content performance
Heatmaps show you whether your content is landing or whether important information sits in the “dead zone” that nobody reaches. This lets you find out which texts are actually read and which areas users hardly ever see.
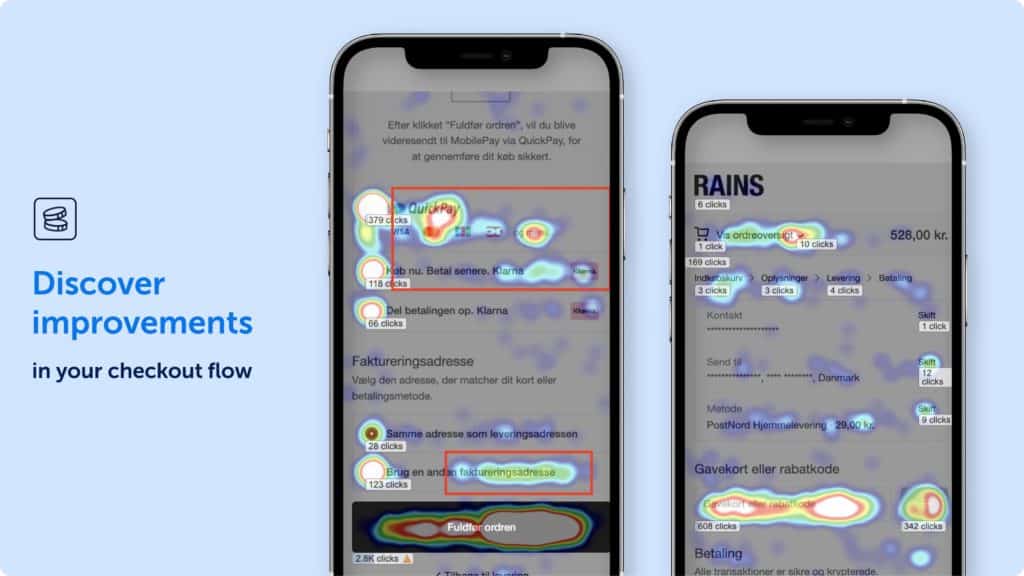
Example of a website heatmap and conversion rate optimisation
The Danish fashion brand Rains showed how heatmaps with Mouseflow lead to measurable results. The company analysed over 500,000 sessions and improved their conversion rate in the shopping cart by 9.8% and in the checkout by 10.8%.
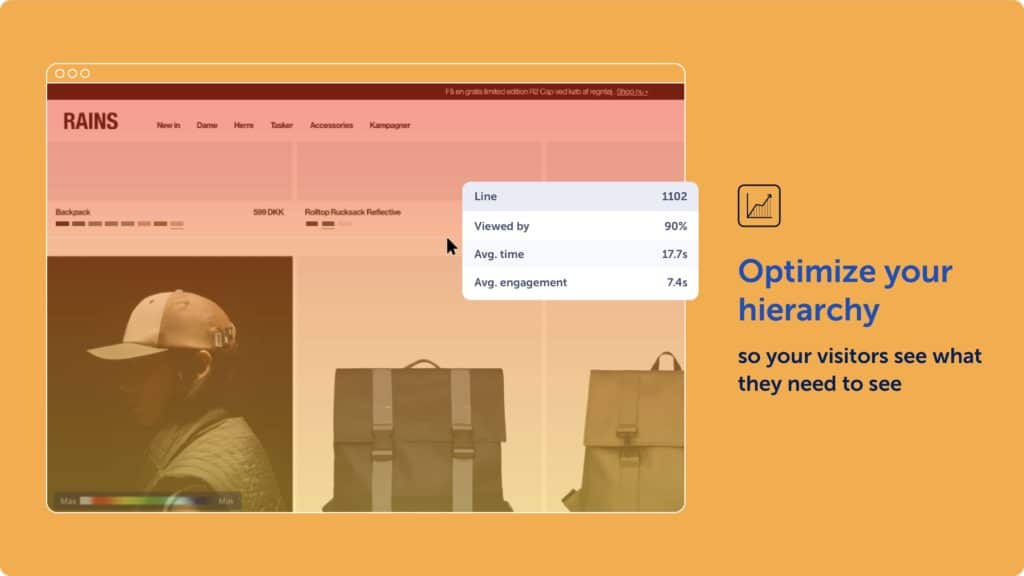
Rains found that many users dropped out of the checkout process. The figures from Google Analytics showed the problem but not the cause. It was only with heatmaps and session recordings that the team identified specific weak points:
- Users clicked on elements that were not clickable
- Important buttons were overlooked
- The checkout process was too complex
Based on the heatmap data, the Rains team created hypotheses, which they put to the test in extensive A/B tests. Their testing focused on usability improvements, such as making previously unclickable elements clickable and streamlining the checkout process.
The changes led to a significant increase in the conversion rate. Importantly, RAINS only implemented changes with a statistical certainty of over 90%.
Typical mistakes when dealing with website heatmaps
The significance of website heatmaps has its limits when the sample size is too small, mouse movement and eye path are confused, or the tests are imprecise.
Sample size too small for website heatmaps
If you create a heatmap for a website with just 50 visitors, missing clicks on a specific button could simply be coincidence. Patterns only become reliable from 2,000 to 3,000 page views. Anything below that could mislead you. Collect enough data before making changes and running tests.
Equating mouse movements with gaze
Many tools advertise mouse tracking as “cheap eye tracking”. But that is only partly true. People often move their mouse to where they are looking, but by no means always. Use mouse tracking only as an indication, not as proof.
Dynamic content confuses heatmap tools
When your website changes depending on the user — through personalisation or A/B testing — heatmaps become blurred. The tools can’t always tell which version a visitor saw. The result is a mixed heatmap that says little. If you want to create heatmaps for different website versions, always do it separately per version.
Using website heatmaps as the sole tool
A heatmap shows you where users are dropping off. But it won’t tell you why. Is it the design? The text? A technical error? To find out, you’ll need other methods: session recordings, user surveys, or direct feedback.
4 website heatmap tools
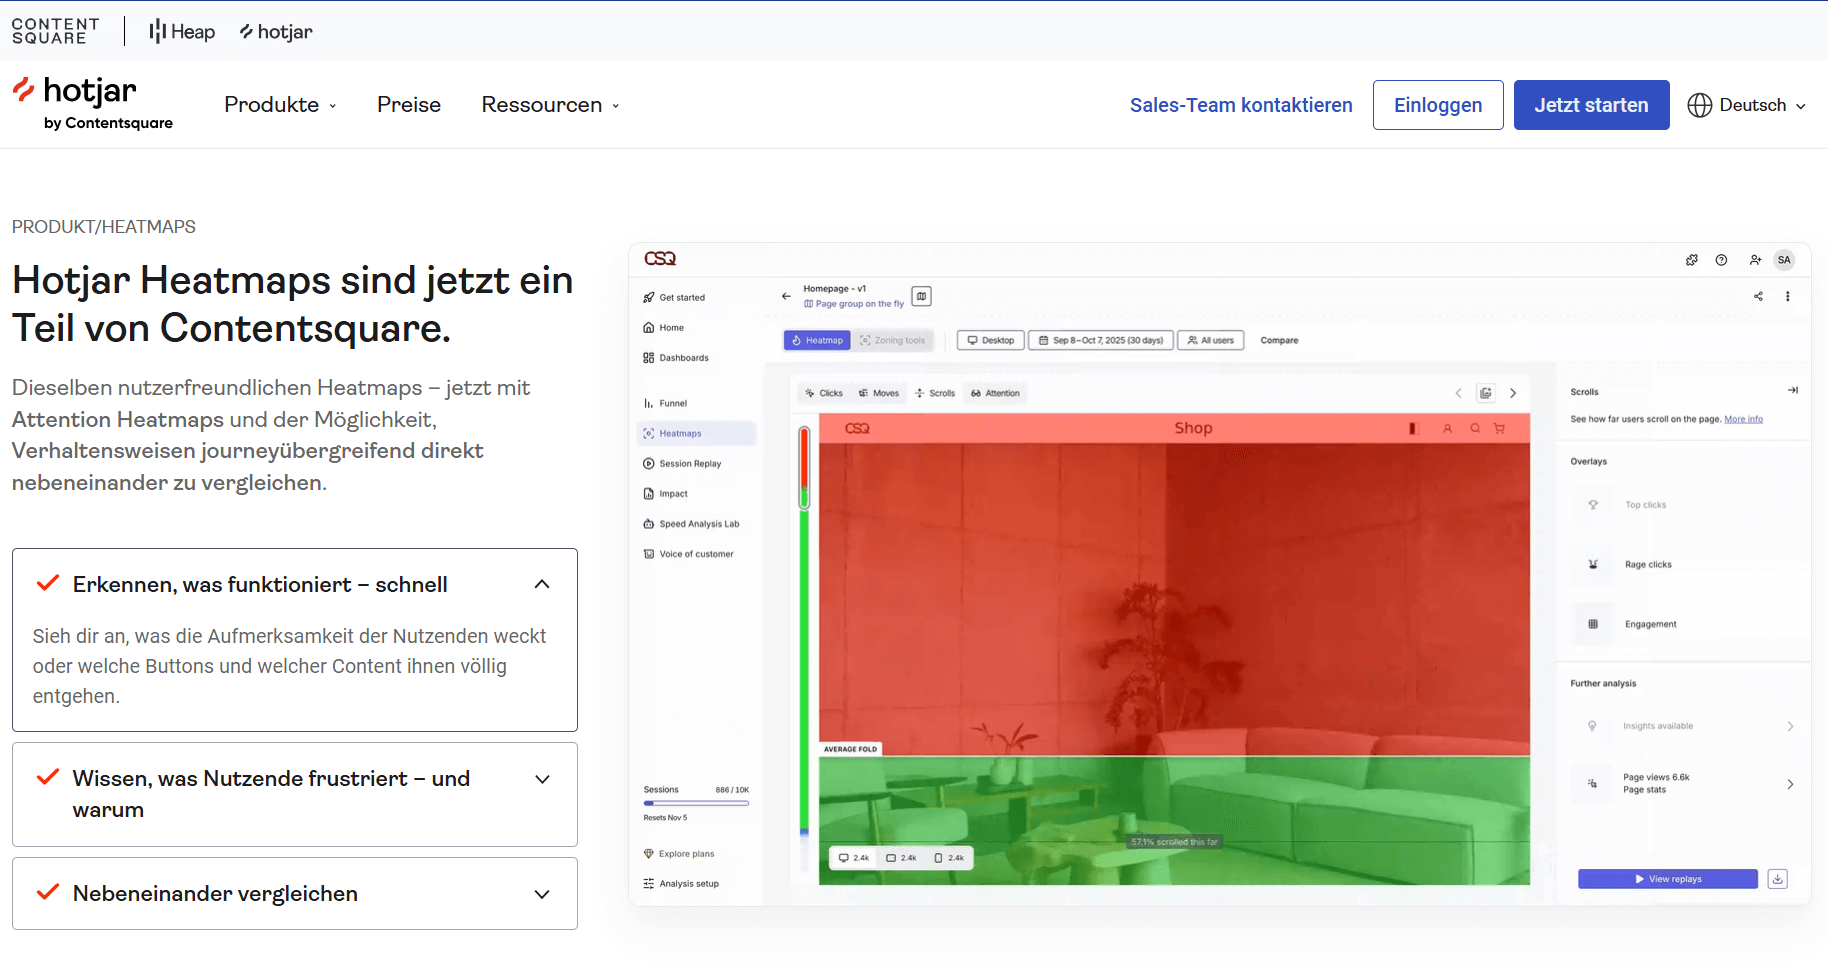
Hotjar
Hotjar is the market leader for heatmap tools. The company offers click, scroll, and movement heatmaps combined with session recordings and user surveys. The big advantage: all tools are integrated. You click on an area in the heatmap and immediately see the associated session recordings.
Pricing starts at $32 per month for 100 sessions per day. There is also a free version with limited features.
Crazy Egg
Crazy Egg focuses on the essentials: heatmaps and A/B testing in one tool. The “Confetti” function, which filters clicks by visitor type — for example by origin or device — is particularly powerful. This helps with target audience analysis.
The downside: Crazy Egg only offers annual billing. Pricing starts at $29 per month.
.png)
Mouseflow
Mouseflow scores points with detailed filtering options and a “Friction Score” that automatically identifies problematic areas. The tool is particularly suited to larger websites with complex analysis requirements.
Mouseflow prices start at $31 per month, with a free version with limited features and sessions also available.
.png)
Microsoft Clarity
Microsoft Clarity is free and offers click, scroll and area heatmaps. A good choice for beginners or smaller projects. Advanced features such as user surveys or A/B testing are missing. Microsoft promotes the software as GDPR and CCPA compliant.
.png)
Heatmaps and conversion rate optimisation from Axisbits
Website heatmaps provide you with the data, but implementation takes time and expertise. For profitable conversion rate optimisation, you must analyse data, develop hypotheses, run tests and correctly interpret results. These are time-consuming steps that require your full attention and can take up many hours a day.
If you want to work on better conversion rates for your website but are overwhelmed by the effort, we can take over the heatmap analysis and ongoing conversion rate optimisation for you. You focus on your business, we focus on your numbers. Get in touch with your project!
{{fs-btn-cta}}
Read more: You might be interested in these topics:
- Our overview of A/B testing tools
- How good UX design contributes to the conversion rate
- 6 triggers for more sales from sales psychology
Wir schaffen leistungsstarke Plattformen und Websites für Startups, Scale-Ups und KMUs, von Konzept bis Go-Live.
We systematically increase your conversion rate with heat maps, A/B testing and proven CRO methods — month by month!
Heat maps for websites — common questions and answers
Most heat map tools are GDPR-compliant if they are configured correctly and no conclusions can be drawn about the behavior of individual users. However, you must provide information about the use in your privacy policy. Check with your tool provider for the correct settings.
With 1,000 visitors per day, you need around 2-3 days for reliable data from the website heatmap. With less traffic, it takes correspondingly longer until the significance is high enough.
Yes, but it works differently than with websites. You need specific SDK tools that integrate with your app. Not all web heat map providers offer this.
High-quality tools only have a minimal impact on loading time. But be careful not to use multiple tracking tools at the same time.
More articles
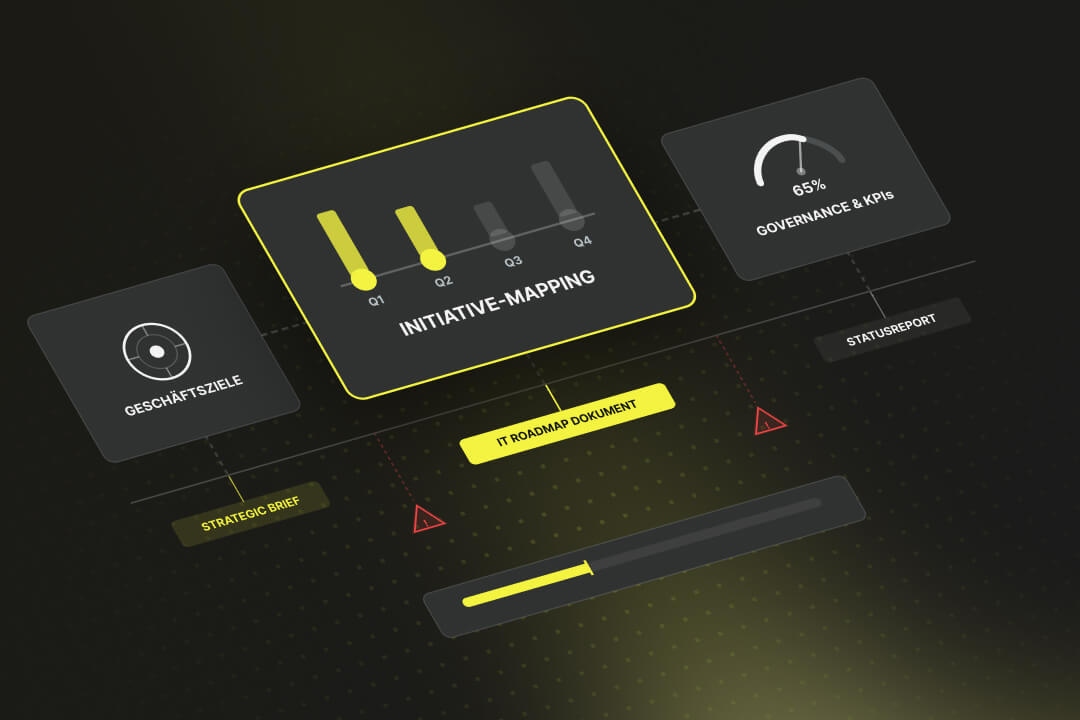
According to the swissICT Digital Excellence Report, only 35 percent of Swiss companies are on track with their digital alignment. For 26 percent, there is significant need for action (Source: swissICT). Companies invest in tools, cloud services, and AI pilot projects without a plan that holds it all together. The result: fragmented system landscapes, duplicated work, and budgets that don't flow where they have the most impact. The right IT strategy is the answer to this.

Artificial intelligence is now an established tool in software development, integrated directly into the programming environment. Developers spend less time writing boilerplate code and can instead focus on how the different parts of an application logically interact.
According to the PwC report Digital Product Development 2025, so-called 'Digital Champions' – companies with a high level of digital maturity – are already expecting and achieving an efficiency increase of 31% and a 20% reduction in operating costs.