Perform, measure and achieve success in UX optimisation
If you buy expensive traffic and then the users jump off again in rows, it's time for UX optimization. In this article, you'll learn more about the benefits and ROI, troubleshooting, and proven measures to optimize UX.
The most important things in brief:
- Companies significantly increase their conversion rates, revenue and customer satisfaction through better user experience
- Immediately effective measures such as checkout or page speed optimisation deliver quick results; strategic projects such as personalisation achieve lasting effects.
- Analysis in 3 phases: UX problems are identified using performance data, user behaviour and funnel analyses, with a focus on mobile UX.
- Optimisation measures are evaluated in terms of reach, impact, prospects of success and effort.
- 62% of traffic is mobile; anyone who does not optimise here will permanently lose users and revenue. Touch zones, loading time and thumb navigation are important levers.
How can I identify UX issues?
When identifying UX problems, many companies recognise symptoms such as high bounce rates or low conversions, but do not understand the underlying causes.
UX problems can be diagnosed systematically in three phases: performance analysis (Core Web Vitals, load times), user behaviour analysis (bounce rate, session duration), mobile UX evaluation (touch targets, responsive design) and conversion funnel analysis (identifying drop-off points).
The 3-phase diagnosis for UX problems
Phase 1, performance analysis: Technical performance forms the foundation of the user experience. Google documents that Core Web Vitals have been expanded to include INP (Interaction to Next Paint) since March 2024. Only 47% of all websites currently pass this rating.
Specific metrics to check:
- Largest Contentful Paint (LCP): Should be (significantly) less than 2.5 seconds
- Interaction to Next Paint (INP): Target value under 200 milliseconds
- Cumulative Layout Shift (CLS): Value below 0.1 for stable layouts
Pay particular attention to the mobile UX evaluation in the first phase. With 62% mobile traffic, mobile-first design is not optional. The Baymard Institute documents that 81% of websites have mediocre to poor mobile performance.
Mobile-specific problem areas:
- Touch target sizes below the 44px minimum
- Horizontal scrolling at standard viewport widths
- Non-optimised form inputs for mobile keyboards
Phase 2, user behaviour analysis: The analysis of actual user behaviour reveals problems that are not visible in pure performance measurement. Relevant key figures differ significantly depending on the industry.
Benchmark values:
- Bounce rate: Average 46.4%, critical from 60%
- Session duration: Varies from 1:23 minutes (news) to 4:12 minutes (e-learning)
- Pages per session: Target value depending on website type
Phase 3, conversion funnel analysis: The systematic analysis of the conversion funnel identifies the biggest drop-off points. Baymard Research shows that 70% of e-commerce users abandon their checkout.
Typical drop-off points by industry:
- E-commerce: Product page (45%), shopping cart (25%), checkout (70%)
- B2B: Landing page (65%), lead form (85%)
- SaaS: Trial registration (60%), onboarding (52% in first 3 days)
UX optimisation measures: Quick wins and large UX projects
Based on the RICE assessment, UX measures can be divided into two categories: improvements that can be implemented in the short term with immediate effect, and long-term strategic projects with transformative potential.
Immediate optimisations
Checkout process improvement:
- Reduce form fields by up to 50%
- Implementing guest orders
- Expected impact: 15 to 30% higher completion rate
- Effort: 5 to 15 developer days
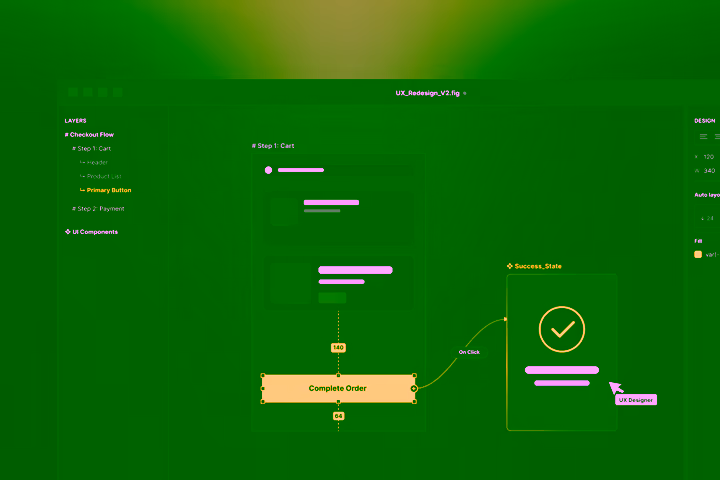
Call-to-action enhancement:
- Contrasting colours and action-oriented texts
- Button sizes for touch optimisation
- Expected impact: 10 to 25% higher click-through rate
- Effort: 2 to 5 designer days
Page speed optimisation:
- Image compression and lazy loading
- CSS/JavaScript minification
- Expected impact: 1 to 2% increase in conversion per second saved
- Effort: 3 to 10 developer days
Strategic UX projects
Personalisation engine:
- Dynamic content based on user behaviour
- A/B testing integration for continuous optimisation
- Expected impact: 20 to 40% conversion improvement
- Effort: 60 to 120 developer days
Complete user journey redesign:
- Redesigning the entire user journey
- Integration of behavioural psychology principles
- Expected impact: 30 to 60% improvement in relevant KPIs
- Effort: 90 to 200 developer days
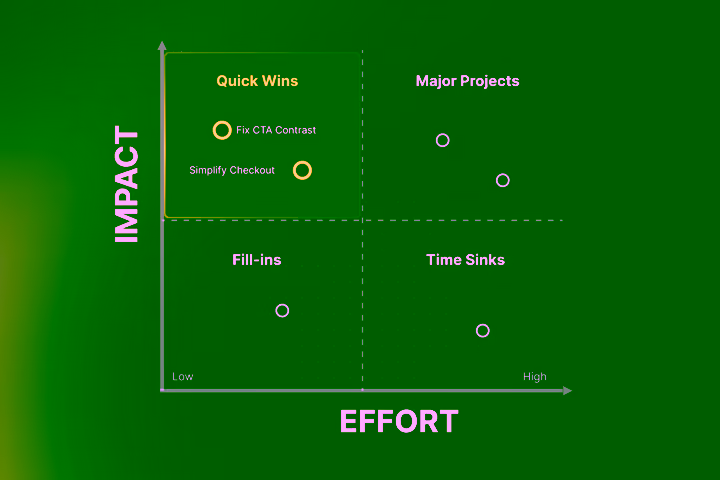
The UX optimisation matrix: effort vs. impact
After identifying UX problems, it is time to strategically prioritise. Not all optimisation measures offer the same cost-benefit ratio.
UX optimisations can be prioritised using the RICE framework (Reach × Impact × Confidence ÷ Effort).
- Quick wins such as checkout optimisation or call-to-action improvements show results within 1–4 weeks with 15–30% impact
- Strategic projects such as personalisation take 3–6 months with 30 to 60% improvements
- A typical checkout optimisation with an investment of 10,000 francs can achieve an ROI of 440% with 20,000 monthly visitors after just 3 months.
Reach: How many users are affected by the measure?
- Checkout optimisation: 100% of users ready to buy
- Homepage redesign: 80% of all website visitors
- Special feature: 15% of power users
Impact: How strong is the expected improvement?
- Massive improvement: 3 points (e.g. 50% conversion increase)
- Significant improvement: 2 points (e.g. 20% improvement)
- Minor improvement: 1 point (e.g. 5% improvement)
Confidence: How certain is the probability of success?
- High confidence: 100% (proven best practices)
- Medium confidence: 80% (good evidence)
- Low confidence: 50% (experimental)
Effort: How many resources are required?
- Person-days for implementation, design and testing
Example:
Call-to-action optimisation: (5,000 users × 2 impact × 100% confidence) ÷ 3 days = RICE score 3333
Complete redesign: (8,000 users × 3 impact × 60% confidence) ÷ 120 days = RICE score 120
Despite its lower impact, call-to-action optimisation achieves a significantly higher RICE score because it can be implemented with a high probability of success and minimal effort. The complete redesign has higher impact but requires 40 times more resources with a less certain outcome.
Benefits and ROI of UX optimisation
UX optimisation is an investment that translates into measurable business results. The available studies and practical examples consistently show positive effects on conversion rates, customer satisfaction and revenue.
The data is clear: companies that systematically invest in user experience achieve demonstrably better business results than their competitors. These improvements are not only statistically significant but also economically relevant.
Examples of the ROI of UX optimisations
Walmart found that saving one second of loading time increases their conversion rate by 2%. For a company with millions of visitors a day, that means: one second faster = several million dollars of additional revenue per year.
Microsoft reduced their customer support enquiries by 30% through user-centred design. This not only means happier customers, but also direct six-figure cost savings.
A German e-commerce company (retail, around 50 employees) invested 20,000 euros in optimising their checkout process. The result over three years: 298,550 euros in additional profit. This corresponds to an ROI of 1,494% — or in other words: every euro invested turned into almost 15 euros.
When does UX optimisation show first results?
- Quick wins can be seen within 1–3 months, some immediately: Checkout optimisation, mobile responsiveness improvements and performance fixes have a quick and direct effect on the conversion rate.
- Strategic improvements take 6–12 months: Complete user journey redesigns or personalisation features require more time, but they also have lasting impact.
- Industry differences: E-commerce typically sees break-even after 3–6 months, B2B software after 6–12 months due to longer sales cycles.
Opportunity costs of UX optimisation
The absence of UX optimisation leads to measurable economic disadvantages. While companies with optimised user experiences expand their market position, companies without corresponding investments face direct competitive disadvantages.
These opportunity costs show up in:
- Higher acquisition costs: more must be spent on advertising to achieve the same results
- Worse Google rankings: Core Web Vitals have been an official ranking factor since 2021
- Lost market share: customers are switching to providers with a better user experience
An example: if your conversion rate is 1.8% and your main competitor optimises to 2.5%, you lose 28% of potential customers for the same traffic. With 10,000 monthly visitors and an average customer value of 200 francs, that is 2,800 francs in lost revenue. Every month.
Key trends in UX optimisation 2025
Three technological developments are currently changing UX optimisation: AI integration for even more personalised experiences, mandatory accessibility standards since June 2025, and new Core Web Vitals metrics.
- Chatbots with measurable ROI: Chatbots automatically resolve 80% of standard queries and reduce support costs by 30%.
- Personalisation: Netflix generates 80% of its views through personalised recommendations. Amazon increases average order value by 29% through personalisation.
- Accessibility: The European Accessibility Act came into force in June 2025 and affects all companies with e-commerce activities in the EU. Switzerland is not directly affected, but Swiss companies with European customers should nevertheless look into it.
Mobile UX optimisation 2025
62% of your traffic comes from mobile devices. 68% of e-commerce sales come from apps. If your website doesn’t perform well on a smartphone, you’ll lose three out of four visitors permanently. Mobile optimisation includes touch target sizes (at least 44px), thumb-zone navigation, progressive web apps and voice commerce integration.
The e-commerce figures are even more striking: 68% of all online purchases are made via mobile apps and mobile websites generate a further 20% of commerce revenue. Desktop has become a niche at 12%.
The consequences of poor mobile UX optimisation:
- 74% of users permanently abandon websites with poor mobile performance
- Mobile conversion rates are 30–50% below desktop performance for non-optimised sites
- 53% of all mobile users abandon pages that take longer than 3 seconds to load
Mobile UX optimisation measures
Touch target optimisation
Best practice: 48px minimum size with 8px spacing between clickable elements.
Thumb zone design
Studies show that 75% of mobile users operate their smartphones with one hand. The natural range of motion of the thumb defines the “thumb zone” — the area that is comfortably reachable. Important action elements belong in this zone.
Progressive Web App (PWA)
PWAs combine web flexibility with app performance. They load 50% faster than normal websites and work offline. Twitter increased their session duration by 65% and reduced the bounce rate by 20% through PWA implementation.
UX optimisation in-house or agency?
Mapping UX optimisation in-house makes sense for long-term projects and therefore continuous UX work. Buying in external expertise is better for an objective assessment of the current state, for time-critical projects and when rapid scaling is needed.
In-house UX optimisation
You already have a functioning development team and need continuous UX support. Costs: 90,000 to 124,000 CHF per UX designer plus 25% social security. Bear in mind that at this price you initially only have one UX designer on board, who is not permanently on the project due to holidays and illness.
External UX optimisation
A UX team brought in as a service provider assesses your current situation objectively and impartially. Internal teams, on the other hand, can be operationally blind and/or communicate in favour of their own work.
Through the service provider, you acquire proven processes and experience. This allows you to scale faster and without personnel risk, and to increase or scale down capacity as needed.
Conclusion: UX optimisation as an investment
UX optimisation is one of the most profitable business investments of all. ROI values of 380% after three months, conversion increases of 30% and support cost savings of 30% are drawn from documented reports.
UX optimisation is just one lever among many. Further levers lie in pricing psychology, copy, trust elements and more.
If you are working on better conversion rates but are overwhelmed by the time required, we can take over ongoing conversion rate optimisation and A/B testing for you.
Let’s look together at where your greatest potential lies. In a free initial consultation, we analyse your most important pages and show you the three most important optimisation steps for your business. Find out more about our work as a CRO agency.
{{fs-btn-cta}}
Wir schaffen leistungsstarke Plattformen und Websites für Startups, Scale-Ups und KMUs, von Konzept bis Go-Live.
We systematically increase your conversion rate with A/B testing and proven UX optimization — month by month!
UX optimization — frequently asked questions and answers
Google PageSpeed Insights and Google Analytics are free and already cover key UX metrics. For deeper insights, Hotjar is suitable for heat maps and user recordings. Figma is standard for design prototyping and the basic version is free of charge. Here you can find out more about A/B testing tools.
Conversion rate, bounce rate, and session duration are the most important KPIs. E-commerce also measures cart abandonment rate and average order value. B2B focuses on lead form completion and time-on-page for important content pages. Always measure before and after optimization for at least 30 days.
UX focuses on user behavior and conversion optimization of those users who are already on the website, SEO on search engine rankings to bring visitors to the website. The two overlap in Core Web Vitals and technical performance. UX improvements often automatically help with SEO, but not the other way around. Ideally, both areas work together.
Bounce rate above 60%, conversion rate below industry average, or poor Core Web Vitals scores are clear warning signs. Have 5 people from your target group perform typical tasks on your website. If they're struggling or frustrated, you're actually having UX issues.
More articles
Just two years ago, building a first functional software prototype took several weeks: setting up the development environment, cobbling together a backend, building a frontend, wiring it all together. Today it takes a few hours and a clear prompt. AI Prototyping has fundamentally changed the process.
68% of all website visitors leave a page after less than 10 seconds, which is almost 7,000 lost customers per month on an average website. The common reason: poor UX design. In this article, you'll learn what UX design is and how you can use it for your business right away.

Do you put a lot of effort into shoveling visitors to your website, even running ads, but users don't want to buy or get in touch? The conversion rate mercilessly expresses this relationship in figures. In this article, you'll find out what the conversion rate really is and how to use it sensibly.